
Help / Overview
Overview
Overview is where you'll spend most of your time. It tells you, in a sentence, what happened to your site's traffic from Google over the dates you pick, then shows the chart and the searches, pages and segments behind the change. It's the place to start when someone asks “how are we doing?”
What you see
When you open Overview, you'll see a headline about what happened, then the chart with its controls, then what moved. Everything follows the date range and comparison you pick in the chart toolbar.
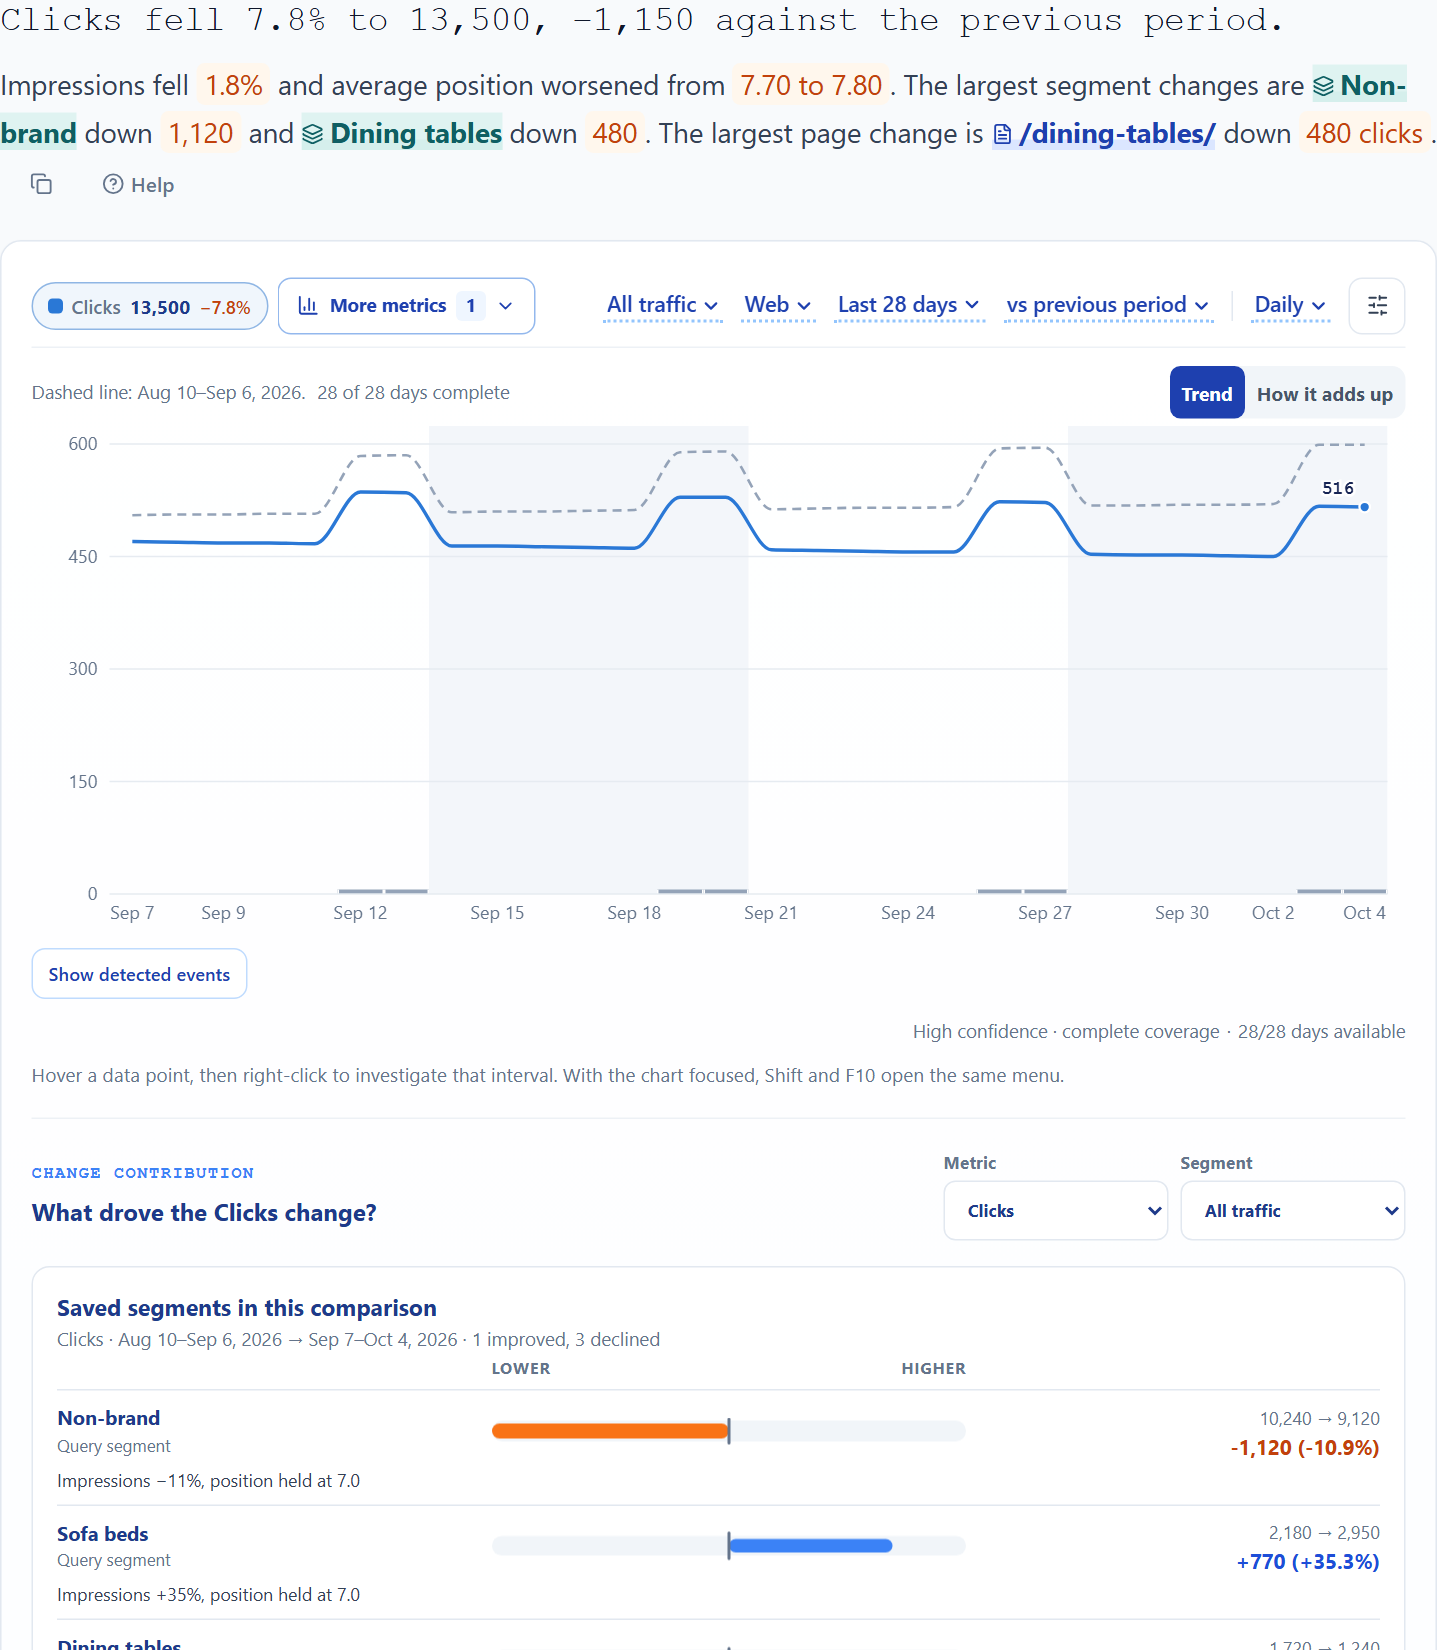
- Headline
- How clicks changed, how impressions and position moved, and which segments and pages moved most in the same direction. The numbers are coloured by which way they moved. It sticks to what happened and never guesses at a cause. With no comparison it just gives the totals.
- Chart toolbar
- Above the chart: All traffic, Web, the dates and the comparison set what you're looking at, and Daily and the settings button set how it's drawn. When you pick a segment it's filled in blue, so you can tell at a glance the chart isn't showing all traffic.
- Metric pills
- One small pill for each line on the chart, with its total and, when you're comparing, its change. Clicks is the only one at first. Add impressions (times you appeared in Google), CTR (the share of people who clicked), position (where you ranked, on average) or anything else with More metrics, and remove one with its ×.
- Chart
- Daily, weekly, monthly or quarterly lines (pick one with Daily above the chart), with your own markers, Google updates and, if you turn them on, events ConsoleKit spotted in your data. The settings button beside it holds everything else. When you're comparing, Pages or Queries swaps the lines for the pages or searches that moved most, and Segments shows how each saved segment moved. Below the chart, What changed is a waterfall that walks from the earlier total to this one, page by page (search by search under a search segment), in clicks or impressions.
- What moved
- Your saved segments first, then the five pages and five searches that moved most. Show top on either card lists more of them in place, and links to the whole list as a CSV.
Common jobs
Compare with an earlier periodPut this period next to the one before, or the same time last year. 1 min
- Set the date range in the toolbar above the chart.
- Select the comparison next to it (No comparison at first) and pick the previous period, the previous week or month to date, or the same period last year.
- The headline and the metric pills now show the change against that period.
If your business is seasonal, compare against the same period last year. That way a normal seasonal dip won't look like a problem. On daily and weekly charts last year is lined up by weekday (52 weeks back), so a Monday is compared with a Monday; monthly charts use calendar months.
Find what drove a changeGo from “clicks fell 9%” to the pages and searches behind it. 2 min
- Choose a comparison in the chart toolbar, such as vs previous period.
- Scroll to What changed below the chart. The waterfall shows how the change adds up to the total; switch it between Clicks and Impressions, and select a bar to list its pages (its searches, when a search segment is chosen).
- Select Pages or Queries above the chart to list the five pages or searches that moved most. Select Show top for more.
- Select Segments to see each saved segment. Each one tells you how its impressions, position and CTR moved.
Watch for notes on rows. Likely URL change pairs a page that fell with a similar address that grew. Position X → Y flags a ranking drop. Not reported this period marks rows that disappeared.
Mark a release on the chartAdd your own markers, like a site launch or a sale, so the chart explains itself later. 1 min
- Select the chart settings button beside Daily, then Manage events.
- Pick a category, and type what happened and when.
- Select Add marker. It appears on the chart on that date.
See detected events on the chartLine up the chart with the changes ConsoleKit spotted in your data. 1 min
- Under the chart, select Show detected events.
- Dots appear in a strip under the dates, coloured as losses, wins, opportunities or things to review. Use the chips to filter them.
- Select a dot to see its events, then open one in Events for the detail.
- A New links story counts links other sites added to yours. Open it to see the ten strongest linking domains. The button beside a domain lists all its links, and the one under the list shows every other domain.
Change what the chart showsAdd counts of searches and pages, position bands or a forecast. 1 min
- Select More metrics to add impressions, CTR, position, how many searches or pages Google reported, or position bands. Each one gets a pill with its total.
- Open Chart settings to change how it looks: lines on top of each other or in separate panels, percentage shares, chart type, month-to-date and forecast.
- A dot on Chart settings means something's different from the defaults. ConsoleKit remembers your choices for each property.
Good to know
- The newest days are still processing. Google takes a few days to finish each day's numbers. Those days are shaded, and if either period isn't complete yet you'll see No complete comparison instead of a change, rather than a misleading one.
- A lower position is better. Position 3 beats position 8, so position improves when the number falls. Every colour and arrow reads that way.
- Segments overlap. One search can belong to several segments, so segment changes aren't added together and there's no “everything else” row.
- Where new links come from. New links stories come from DataForSEO's link index, and single linked pages from Mentions. A link's date is when it was first found, which can be days or weeks after it was published. New links only appear once a workspace admin connects your own DataForSEO account in Settings → Integrations, and DataForSEO bills that account. The first time anyone opens a story its links are fetched and saved, so opening it again or expanding a domain is instant and costs nothing more.
- Copy as Markdown. The copy icon beside the headline puts it on your clipboard as Markdown: the headline in bold, the sentence under it and the key numbers, with the report and property named on the last line. Paste it straight into Slack, an email or a doc.
| Pages and queries in the What moved cards | 5 each |
|---|---|
| Detected events on the chart | 300 per range |
| DataForSEO spend | Your own monthly limit, set in Settings → Integrations ($25 to start) |
| Links saved per story | The 1,000 from the strongest domains |
Last reviewed and updated