
Help / Dashboards
Dashboards
Numbers on their own don't tell a client much. A dashboard is a report that reads like a story: the headline numbers, the evidence behind them, your notes on what it means and what happens next. Build one from a ready-made starting point, then share a link or present it as slides.
What you see
You'll find Dashboards under Report. Each one is laid out in numbered sections: headline numbers, the evidence under them, your notes and the next steps.
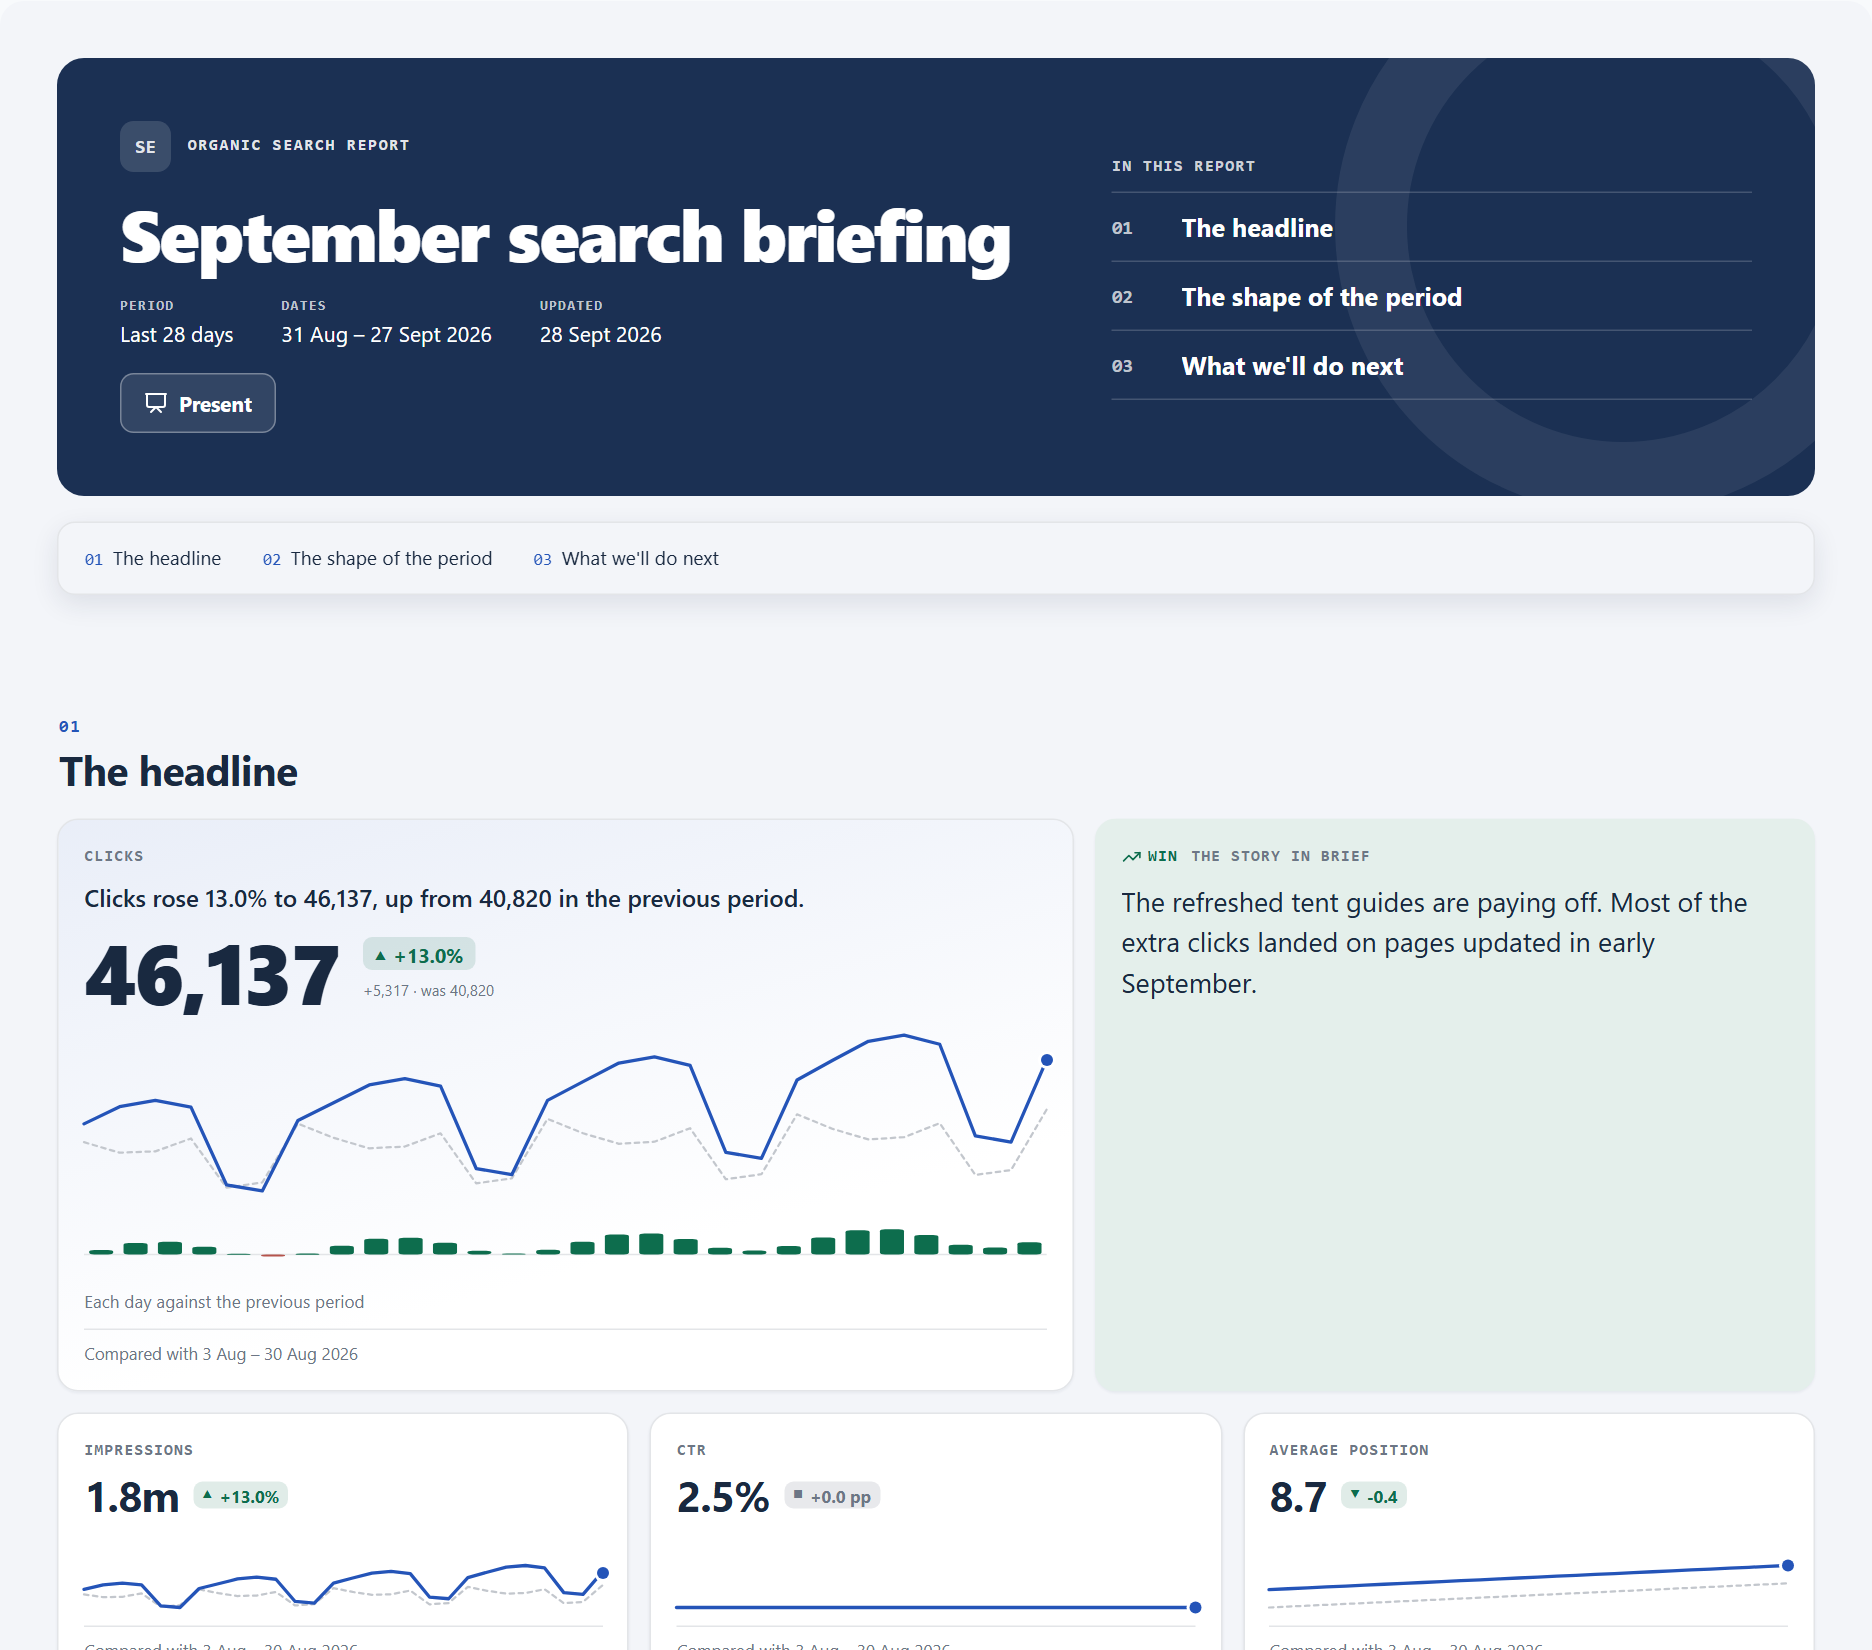
- Starters
- Ready-made layouts, like Monthly client report or Traffic change investigation, or a blank canvas if you'd rather start from scratch.
- Widgets
- The building blocks: headline numbers, KPI tiles, trends, drivers, leaderboards, opportunities, spotlights, callouts and action plans. Each one writes a one-line takeaway you can rewrite.
- Story outline
- Your sections in reading order, with a count of notes you still need to write.
- Draft and published
- Your edits save to a draft. Readers only see what you publish.
Common jobs
Build a monthly client reportStart from a ready-made layout instead of a blank page. 5 min
- Open Dashboards and select New dashboard.
- Name it, pick the Monthly client report starter, and choose Scrolling dashboard or Presentation slides.
- Select Create dashboard.
- Write the callouts and action plan. Any you haven't written yet are marked Not shown to readers, so your client never sees a blank.
Reporting on a launch or a site move? The Launch or migration tracker starter asks when it went live and compares the same number of days either side.
Add and arrange widgetsChange what the report shows, and in what order. 3 min
- Select Add widget and pick a type. New widgets go at the end.
- Drag a widget by its handle to move it, or use the position control in Widget options.
- In Widget options, set its metric, dates, comparison or saved segment, and rewrite or hide its takeaway.
Brand a reportUse your client's colours and logo. 2 min
- Select Branding.
- Pick a colour preset or set your own colours, add a logo, and choose the spacing and heading style.
Present a report to a clientWalk through it one section at a time. 1 min
- Select Preview, then Present.
- Move between slides with the arrow keys or the buttons.
- On a computer, select Presenter view to open a second window with your notes, the next slide and a timer. If your browser blocks the pop-up, allow it.
Good to know
- Takeaways describe, they don't explain. Automatic takeaways repeat what the widget's numbers say and never guess at a cause. That's your job, in the notes. They're left out when a comparison isn't complete.
- Gaps in the data stay visible. What each widget is compared with, any missing days and any cut-off tables are noted under it.
- Deck checks are just advice. Slide decks are checked against a few simple storytelling rules, like one takeaway per slide. The checks never stop you saving or publishing.
| Widgets per dashboard | 50 |
|---|---|
| Steps in an action plan | 12 |
| Written takeaway length | 280 characters |
Last reviewed and updated